Analysis: E-commerce Conversion Rates 2021
Why do you need to compare your E-commerce conversion rate with others? Having conversion rate data on your E-commerce business but having nothing to compare it to gives you limited information only about your progress. Are you doing better than the competition or worse and what could you improve? Comparing important KPIs in business is […]
Why do you need to compare your E-commerce conversion rate with others?
Having conversion rate data on your E-commerce business but having nothing to compare it to gives you limited information only about your progress. Are you doing better than the competition or worse and what could you improve? Comparing important KPIs in business is key to reviewing the effectiveness of your approach and knowing whether you are on the right track. This post focuses on compiling the conversion rates of the E-commerce industry from various free online sources, which are publically available. The data found below has all been updated to match 2021.
How do you measure conversion rates?
In order to properly compare your conversion rate stats with other website owners, you need to define “conversion rate” the same way as they do. Are you going to divide the total number of sales by unique visits or total visitor sessions? If we refer to Google to answer the question for us in Google Analytics, we can safely say that the answer here is:
You can calculate your conversion rate this way: Transactions divided by sessions, expressed as a percentage.
For example, if you have 14 sales, every 100 visits, you would have a whopping conversion rate of 14 per cent.
Simply calculating your e-commerce conversion rate and comparing it to the entirety of data out there won’t work. Make sure to take the exact industry you are in, with the exact target groups of customers and price range as closely as possible, if that data is available. You can segment conversion rates by different types of visitor, or by product, depending on your goals.
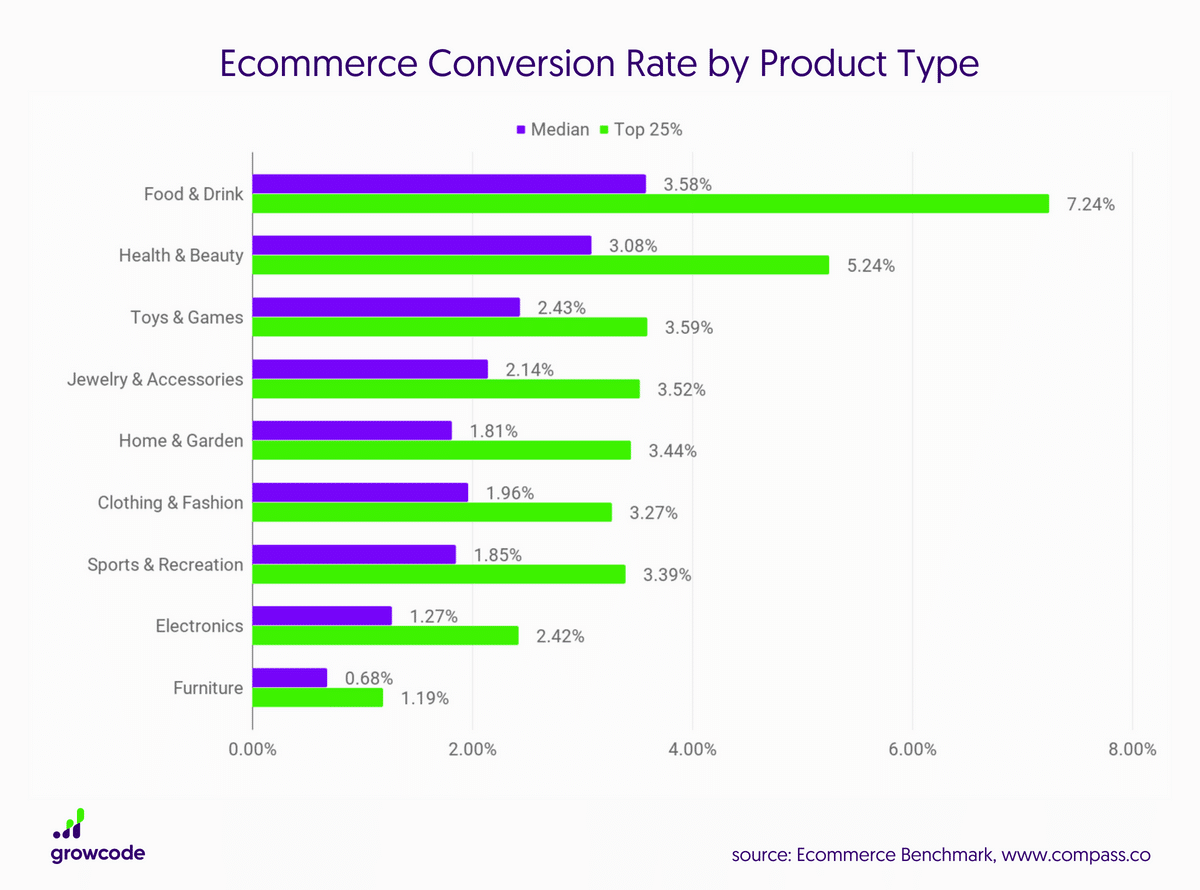
2021 E-commerce conversion benchmarks, segmented by industry
Below, in the graph, you can see how most industries currently do in 2021. The purple blocks are the median, meaning the average for the industry, whereas the green is the top 25 per cent of most converting online businesses in the given industry segment. By looking at the data, you can clearly see that the outliers outperform the rest in terms of conversion by roughly 50 per cent.
Take a look at the graph, and know that some services and products that are on-demand are likely to have much higher conversion rates, which makes the PPC cost of advertising them go to the roof. For example, flowers as a product, and electricians, plumbers, locksmiths, namely services or demand, are very likely to convert right away with a much higher rate than others.
Sometimes comparing your stats by industry, product or target audience isn’t enough. If you operate in a certain area, the United States, let’s say, you can use the e-commerce conversion rates by geolocation and device, for example, and see where it best fits to advertise your business more. Moreover, comparing your conversion rate by the traffic source could be of great importance. Are you spending more per conversion than your competition? If so, that would be an expense you are going to have to tackle down at some point in time, in order to optimise your business.
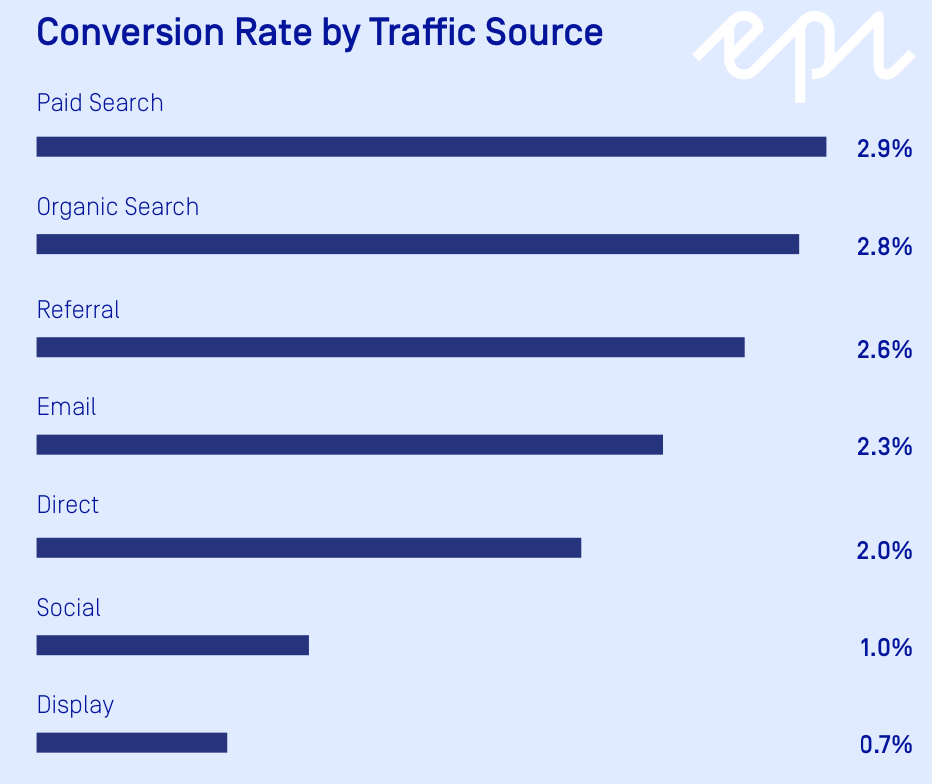
Conversion rate by channel (traffic source)
In the graph below, provided by davechaffey.com, it is evident that the more a certain client is searching for a product, the more likely they are to convert as a buyer. This is the main reason why there are higher conversion rates in Paid Search and Organic. Of course, you are the sole chief of your approach and if something works for you, great. But if you are out of ideas, consider adding one of the sources below to further increase your conversions in terms of numbers.
How to compare your E-commerce conversion rate more effectively?
Comparing your conversion rate by segment means you are already on the right track but there are a lot of other options to choose from that might not hurt, and would give you an overall edge towards getting the right number. You can compare online metrics by segment, device, operating system, country, and other factors. Comparing yourself to some other business across the world might not give you the best idea of where your business stands unless you are competing for the same customers they are.
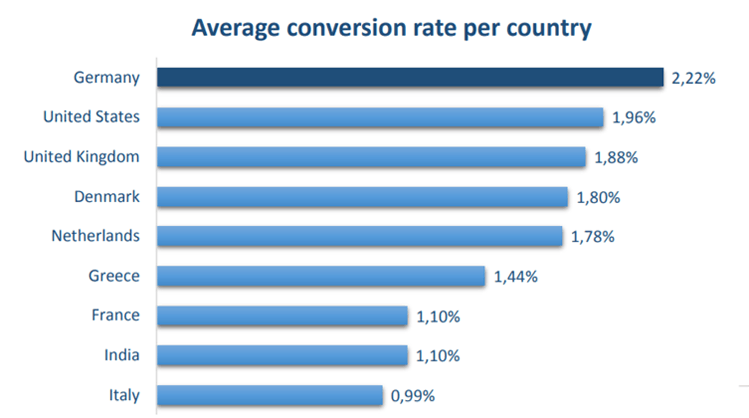
E-commerce conversion rates by country
Always try to compare whatever online metric you are comparing with the most recent data you’ve found. If you compare Italy to Germany, there is more than 120 per cent difference in the increase in conversions between both countries. The main factors responsible for this huge gap can be investigated but what matters is the point is proven that you should compare locally with the same market your product is swimming in.
E-commerce conversion rates by device and operating system
Nowadays, most people tend to stick more to their smartphones and use PCs or laptops only for work and related activities like online meetings. It’s vital for e-commerce business owners to know which benchmarks they should be reaching on smartphone devices. For example, there was a trend in 2020 that showed us the average desktop e-commerce order being 42 per cent more valuable than the ones made on mobile phones.
You can also divide your conversion by the operating system, for example, iOS conversions are a bit higher than Android ones. What might be the reason? Are iOS users more inclined to purchase due to more funds or other demographic, or social reasons? This is unclear and you can make your own assumptions based on them. But you can rearrange your budget to fit your own hypothesis and test how it works.
What is the M-commerce Gap?
Due to empirical data over the years, we can assertively state that mobile converts much less compared to desktop. In the graph below, you can see how people usually spent more time on mobile and convert much less compared to Desktop devices such as laptops and PCs. Doesn’t more time spent on a device mean there should be more conversion from that very same device? Well, it’s complicated but the short answer is “No.”
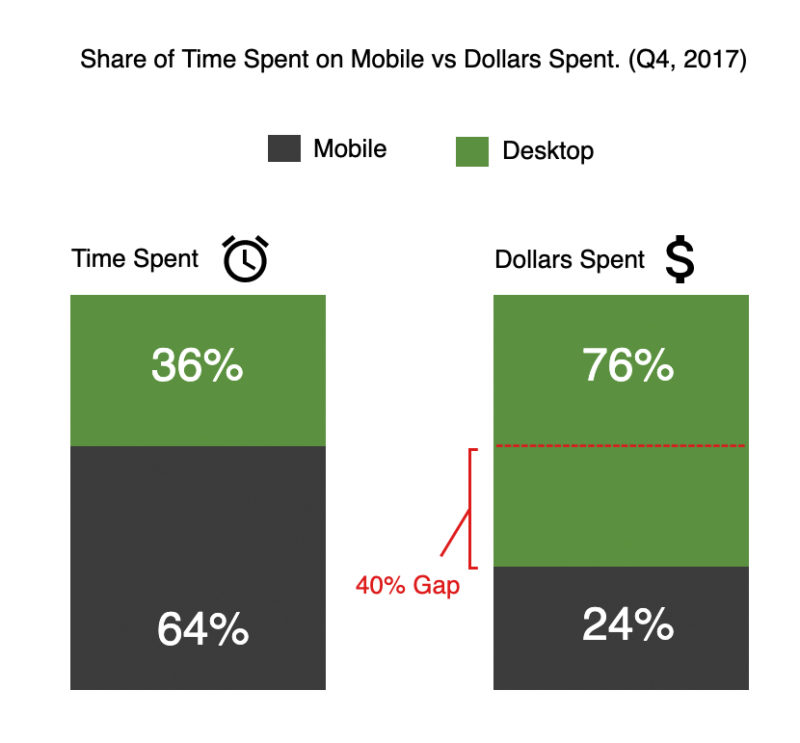
The aforementioned and shown gap means that all mobile retailers have not been able to properly capitalize on the huge amount of time spent by consumers on their mobile devices. What might be the main reason for this?
- Consumers cannot see enough product details due to responsive design not working properly.
- The website/app isn’t optimised enough, thus navigating through the product information is difficult.
- On mobile devices, it’s difficult to browse multiple products and compare screen data.
- It’s more difficult to input purchase details, especially for the older generation.
- Most users have security concerns when using a mobile device.
Looking into these reasons, some of them are actually very realistic to overcome by implementing changes in your online environment. Of course, if you are limited to selling on a certain platform, there is only so much you can do.
How do E-commerce conversion funnels work?
Why do you need to know how a sales funnel works? Well, looking at the depiction below you can make the conclusion that only around 2 per cent (in the given example) of the customers actually reach the conversion. That being said, if you for some reason direct all of your efforts toward making a conversion, you are missing on the first 6 steps in the process, eventually limiting the number of people getting there.
The ideal sales funnel should be designed specifically to guide customers through every stage naturally and seamlessly. Every click should be so intuitive that even a person not speaking the language should be able to reach the checkout.
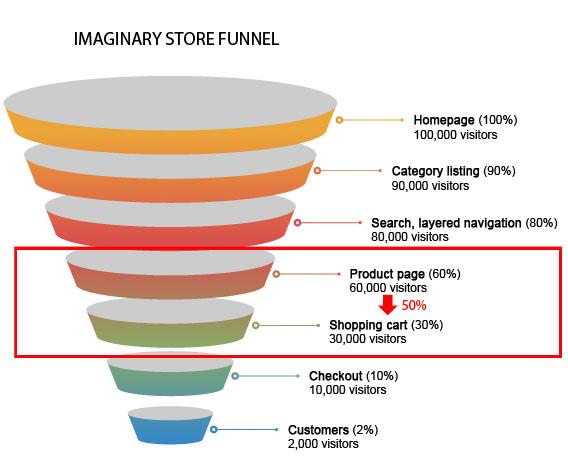
As expected, not all of your homepage or landing page visitors reach the product page or even the shopping cart. Even less so get to the checkout and convert it into an actual sale. Each point in the funnel requires your special attention and can be optimised via different methods in order to lead to where you want your customers to be – the bottom of the funnel.
Increasing your E-commerce conversion rate with a visitor-tailored approach
If you think about it, different types of visitors, coming from traffic sources and backgrounds might come to your website for different purposes. Analysing and breaking down all of this information is easier nowadays than in the past. You get pixels, analytics and data that shows you exactly how much time someone has spent on any specific product and you also get to know in bulk where these users have come from. Segment your users and analyse them, then treat them differently to optimise conversions.
Segmenting your visitors to increase conversions
Identifying the main differences between your visitors is the first step toward treating them differently. For example, some might have little to no information about your product, we shall call these first-time visitors. Others might have already visited and don’t need as much information. These might be looking to purchase as soon as possible, or are looking for something they’ve missed in their earlier visit. So what types of visitors can we differentiate?
- First-time visitors.
- Repeat visitors
- Registered, or previous conversions.
- Users, segmented by search type, for example, paid traffic, organic traffic, etc.
Aside from these, always know that different product category types yield different conversion rates. If you are operating a store with many different products, don’t wonder why some sell more than others, if you’ve targeted the same people. You won’t find much success selling professional gaming mice to 40-year-old women, whereas recipe books, kitchen appliances, furniture and home and garden items might be the case. Of course, that needs investigation and generalisation of your audience.
Some potential customers are in for the promotions. Some studies state that e-commerce marketing strategies are the most successful in cases of active promotions that lead to a vast increase in conversion rates.
Generating the right leads
Regarding whether you are into B2C or B2B E-commerce, or online business, your lead generation game should be quite different. With B2B clients, many things work that don’t with B2C ones and vice-versa. If you are looking for these bulk sales and long-term partnerships that might benefit your business you should take on a more personal approach.
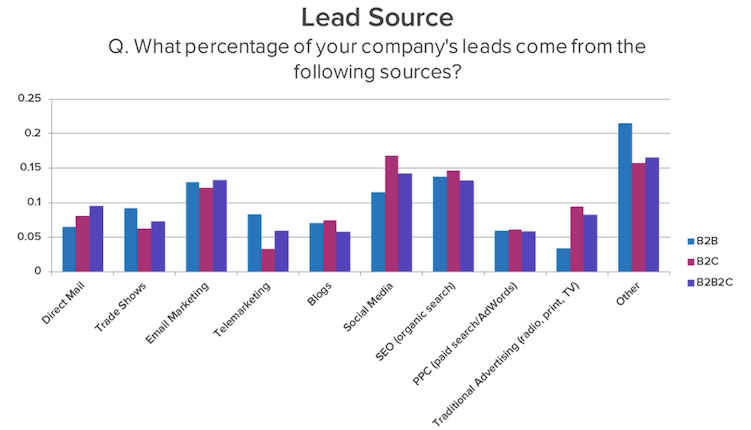
It’s more than likely for a B2C business to generate more leads via Social Media than a B2B one, for the aforementioned reason of things being personal. That leads us to email marketing being more effective for B2B sales. The “Other” section of the graph entails retail, live meetings, networking, etc., which are not really necessarily online. Of course, all of these lead sources have a different ROI, and email leads the chart, being cost-efficient, followed by SEO and PPC.
Talking about PPC, and impressions, Google has constantly reported higher conversion rates through their Search Network and not the Display one. If you’ve been following this post closely you should be able to answer why.
A: The Display Network offers products and services in terms of ads on an algorithm media buying principle. Whereas the Search network ads are triggered by specific searches for the very same product, which makes it much more likely to convert. The CTR (Click-through rate) for Google Ads on mobile averages for all industries at 4.10 per cent, whereas the display network yields only 0.60 per cent.
Conclusion
Regardless of your business type and e-commerce products, you should pay close attention to your audience and their needs. Make sure that you target the right people and that you have designed the best sales funnel for your needs by checking your conversion rate in each step of the process. How many are reaching your checkout compared to the industry average? Optimise, optimise, optimise and if you’ve never actually compared your conversion rates before, start now.
More from our blog
All you need to know about Multivariate Testing